Computer Chronicles Revisited 87 — Microsoft Excel, Trapeze, Words and Figures, and Predict!
On May 2, 1985, Bill Gates and Steve Jobs held a joint press conference at Tavern on the Green, the famous restaurant in New York City’s Central Park. The co-founders of Microsoft and Apple, respectively, announced the forthcoming release of Excel, Microsoft’s newest spreadsheet program for Apple’s Macintosh. This wasn’t Microsoft’s first spreadsheet. Three years earlier, in 1982, Microsoft released Multiplan. But it had failed to gain market share against the dominant Lotus 1-2-3. So Gates decided to cede the traditional spreadsheet market to Lotus and refocus Microsoft’s efforts on the Macintosh’s graphical user interface.
Meanwhile, Lotus tried to make a big splash on the Macintosh with Jazz, which it had announced a couple of months earlier at the first MacWorld Expo in San Francisco. Jazz was not a port of 1-2-3 but rather an entirely new product offering an integrated suite of spreadsheet, word processing, database, and communications applications. While Excel had its own advanced features, Microsoft was careful to describe it as a “multifunctional” spreadsheet rather than an integrated office suite. Even Jobs, likely burned by the failure of the Apple Lisa’s “integrated software” approach, was content to proclaim Excel as the “world’s best spreadsheet” at the press conference.
Not everyone was reassured by Jobs’ assurance. San Francisco Examiner tech columnist John C. Dvorak noted that Microsoft had kept a tight lid of secrecy on the development of Excel–going so far as to strong-arm computer magazine editors into not discussing any details of the product prior to the May 2 press conference. Dvorak said his own columns were censored in various publications (though not the Examiner) to remove any references to Excel.
Dvorak suggested one reason for Microsoft’s secrecy was that there was a chance Excel wouldn’t launch on schedule–just like another long-promised product called Windows. Dvorak turned out to be wrong on that score. Microsoft started shipping Excel in October 1985, which was within the margin of error for the four-month release window Gates promised back in May.
Indeed, Excel quickly became a commercial success, easily outselling Jazz. It was also a critical darling. For example, Neil Shapiro wrote in his review for the October 1985 issue of MacUser that while Excel certainly had a learning curve it was more than worth the effort:
Power users take note: The Macintosh is now the best choice available for spreadsheet sharpshooters. Microsoft’s new Excel takes the price for the most powerful spreadsheet around and offers capabilities hardly ever dreamed of before, including a fully-integrated and full featured charting package as well as many database functions. Excel is the Uzi submachine gun of the business world…
By early 1987, Microsoft was prepared to take Excel to the company’s native MS-DOS platform. But there were still some challengers looking to break into the Macintosh spreadsheet market, as we’ll see in this next Computer Chronicles episode from April 1987.
Was the Mac Now a Viable Option for Business?
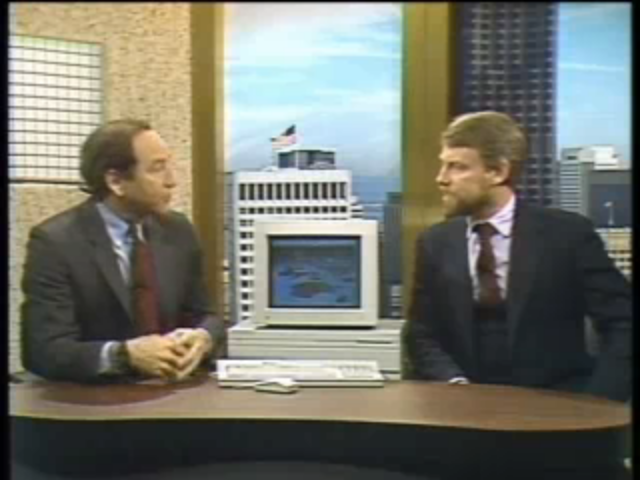
This was the third in a four-part series on business applications and the second to focus on spreadsheet software. Stewart Cheifet noted that in the prior episode they discussed MS-DOS spreadsheet software, as that was what most businesses used. But on the set was a new Macintosh II with a color monitor (see below), and this machine looked and acted a lot more like a business computer. Did co-host Gary Kildall think that the Mac would now be a serious player for people who used spreadsheets?
Kildall said that when the Mac was first introduced in 1984, it really wasn’t targeted at the business market. In those days, the typical business applications were a spreadsheet, word processor, database, and so forth. But the original Macintosh was really a graphics engine with a small, slow disk. But now the two worlds of business and the Macintosh had started to come together with applications like desktop publishing, image processing, and creating rich text. The Macintosh II had a large-size screen (13 inches), a hard disk, and a local area network that could hook up to IBM machines. So the Mac could now be considered a good choice for business.
The “Look and Feel” Wars Have Begun
Wendy Woods presented her only report for this week, which focused on Lotus Development’s recent lawsuits asserting copyright over the “look and feel” of its Lotus 1-2-3 spreadsheet. (I actually covered the outcome of these lawsuits in the previous post when discussing one of the defendants, Adam Osborne’s Paperback Software International.)
Woods provided narration over some footage of three seemingly identical computer spreadsheet screens. The fact they looked similar was part of the reason for the sudden increase in lawsuits between software developers. Lotus was suing Paperback Software International (PSI) over the similarity of its VP-Planner program and Mosaic Software for its Twin spreadsheet.
Tim Hale, an intellectual property attorney with Nelson & Russo, told Woods that the heart of Lotus’ legal complaint was that Mosaic and PSI both infringed the overall “look and feel” of Lotus 1-2-3. Specifically, Lotus claimed the defendants used similar command names, menu structure, and syntax, such that the user who looked at one program versus the other would say the overall look-and-feel was the same.
Woods noted that while a program’s source code was clearly protected by law, the elusive “look and feel” of a screen display was a relatively new aspect of software protection–and opened to sharp disagreement. Richard Bezjian, the president of Mosaic Software, told Woods that you could not copyright or patent the “functionality” of a computer program. He insisted that most of the words in the user interface should be available to other programs, especially common words.
Hale explained that if you took a simple book, the words contained in that book were all common English-language words. They were not “original” in that sense. What became original was the manner in which the developer put them together, the way that they organized or sequenced them. That was what copyright law protected.
Woods said that a recent case involving communication software could have a significant impact on future “look and feel” cases. Digital Communications Associates (DCA), which owned the software Crosstalk, sued Softklone Distributing Company, for its its Mirror communications package. The court ruled in favor of DCA. Hale said that the judge found that essentially one screen was enough to constitute copyrightable material, and the defendants infringed that key screen, which meant that cloning user interfaces would be extremely suspect in the future.
One of the many difficulties encountered by software developers, Woods said, was the overwhelming dominance of a handful of programs, which some companies viewed as de facto standards. Mosaic’s Bezjian said when you go into a market like spreadsheets, you realized that there was primarily one company dominating the market, and that was Lotus, which had between 60 and 80 percent market share. So Lotus’ de facto standards made it literally impossible for anybody to enter the market or do anything constructive.
Woods said that all sides agreed–for different reasons–that the outcome of these cases would have a major impact on the future of original software. Bezjian said that if Lotus won, it would be chaos. People would start doing things just for the sake of being different, and it would be incredibly hard for users to do anything with these programs. Attorney Hale, however, said that one of the purposes of the copyright laws was to reward people’s invention. He wasn’t sure that “cloning” someone else’s software was that creative.
Spreadsheets…Now in Living Color!
Mike Slade and Andrew Wulf joined Cheifet and Kildall for the first studio round table. Slade was the Macintosh product manager for Microsoft Excel. Wulf was president of Data Tailor, Inc., which developed the Macintosh spreadsheet program Trapeze.
Kildall opened by noting that the “granddaddy” of computer spreadsheets, VisiCalc, was a character-oriented program. There was then a major generational change when Lotus 1-2-3 came out with graphics. Did Slade think the Macintosh II represented another generational change when it came to spreadsheets? Slade said the Macintosh in general helped that change to occur. The whole notion of a graphical user interface with pull-down menus, a mouse, and icons led Microsoft to design Excel, a spreadsheet that was more like working with pieces of paper on a desktop and letting you make relations between those pieces of paper. The Macintosh II just extended that in many ways, including color graphics and enhanced speed.
Kildall asked Wulf for his thoughts. Wulf saw the Mac II as allowing people to do things they hadn’t been able to do before, such as working with larger spreadsheets, calculating more complex models, and displaying more charts. That would improve a lot of people’s productivity.
Turning back to Slade, Kildall asked for a demonstration of Excel. Slade opened up a sample file and noted that Excel didn’t look much like a traditional spreadsheet. There were not one, but several different worksheets opened, which looked like different pieces of paper on your desk. You could zoom the screen up and work with one or several sheets at a time, build formulas by pointing and clicking, and stroll around the worksheet just by using a mouse. (For context, we’re talking about an old-school Apple mouse with one button and no wheel.)
Slade continued that it was very easy to build relationships between worksheets just by pointing and clicking. He demonstrated how you could take two subsidiary worksheets and paste their names into a “total” spreadsheet, which created links between the three worksheets. So if later, one of the values changed on one worksheet, that was instantly reflected on the linked spreadsheet. Slade said you couldn’t do that in Lotus 1-2-3, since it could only display one spreadsheet at a time.
In the same way, Slade said, it was easy to take a group of numbers and quickly open a window that had a graphical representation of those numbers, which would then be linked. On his sample file, he selected a group of numbers and created a bar graph. He then showed how when you changed one number on the worksheet, it was immediately reflected in the graph. The Macintosh also had a built-in pictorial gallery that made it possible to pick between different kinds of charts. So you could easily redraw a given chart in a different format.
Slade continued that one of the nicest things about Excel was that it let you automate things using macros. Excel actually recorded what you did and played it back. Slade demonstrated this by running a macro he previously recorded that prompted him to enter data into a worksheet, and then automatically used that data to create a chart. Cheifet clarified that Slade didn’t have to write the macro, it simply created one by recording what he did before. Slade said that was correct. You could write out the macro if you wanted to, but it was simple to have Excel do it for you.
Turning back to Wulf, Cheifet noted that his program, Trapeze, took advantage of the color available on the Macintosh II. What role did color actually play in spreadsheets? Did it matter at all? Wulf said color could help a person who was developing a spreadsheet to show their numbers in a way that was easier for other people to comprehend. For example, you could show different numbers in red to indicate you were losing money, or highlight labels with color so they were easy to find in a large worksheet. And of course, you could do charts in color, which made it much easier to display information graphically than you could with just black and white graphics.
Cheifet asked for a demonstration of Trapeze. Wulf opened three sample worksheets. He explained that the difference between Trapeze and a traditional spreadsheet was that instead of having rows and columns, it was a free-form type of spreadsheet. The basic unit was a block, which was a collection of numbers that could be a row, a column, a table, or even an individual value. Each block had a name, which could be used to build formulas. The blocks themselves could be moved around the spreadsheet and re-sized to change their shape without affecting the underlying formulas. The relationships between the blocks were totally independent of where the block was actually located. You could also build charts within the same spreadsheet page.
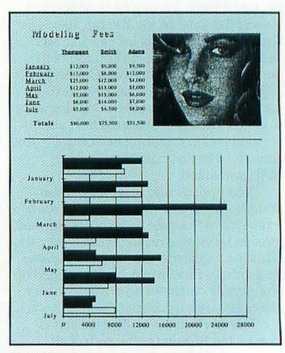
Wulf noted that because the Macintosh was so good at doing fonts, styles, and pictures, there was no reason why you couldn’t include a picture within a worksheet. So you could have a data entry form with calculations on top mixed in with graphs and pictures (see below). Trapeze therefore allowed you to not only do calculations, but also lay them out in an attractive manner. A lot of people who did calculations needed to present them to people, so Trapeze enabled them to do so without having to use another program to put all of the pieces together.
Cheifet asked if Trapeze was written especially for the Mac II. Wulf said it ran on all Macintoshes. The version he demonstrated was shipped in January 1987 before Apple released the Mac II. But they were working on a new version specifically for the Mac II to take advantage of the additional colors and features.
Cheifet asked Slade if Excel required a Mac II. Slade said no. Excel was written almost two years ago and ran fine on the Mac II but also worked on the entire Macintosh family. Microsoft was also working on a new version for the Mac II, however, to take more specific advantage of its capabilities.
Adding Word Processing and Probability to Traditional Spreadsheets
Camilo Wilson and Richard Roth joined Cheifet and Kildall for the final segment. Wilson was president of Lifetree Software, which developed Words and Figures. Roth was director of Unison Technology, which developed Predict! (Yes, we have an exclamation point in a software title for the second week in a row!)
Kildall asked Wilson if he felt more people would move towards high-resolution, color graphics for spreadsheets, or would they stick with the traditional Lotus 1-2-3 model? Wilson said there was no doubt that some people wanted to look into the “world of the future.” But the fact was that 1-2-3 currently had an install base of around two million copies. And the last thing people wanted to do was re-learn what they already knew.
Turning to Roth, Kildall said that both he and Wilson offered products that improved upon the 1-2-3 model. What sort of things did Unison do with Predict!? Roth said Predict! took what everybody already knew in terms of the spreadsheet model and added the capability to express “uncertainty” in their forecasting so they could model various business situations.
Kildall then asked Wilson for a demonstration of his product, Words and Figures. Wilson said the product was based on the idea that people wanted a reasonably priced Lotus-compatible spreadsheet. Words and Figures provided this. On top of that, Words and Figures also included a word processor, which was the most commonly used function on personal computers.
Cheifet asked about the logic of bringing a word processor into a spreadsheet. Wilson said the logic was that if you had a financial story to tell, you might want to tell people a “verbal” story as well. Pulling up a sample document in Words and Figures, Wilson explained that it looked much like any other Lotus-style spreadsheet. But you also had access to a word processor by pressing a single key as opposed to loading a separate program. And he emphasized that the word processor felt “like a real word processor.” A lot of people used 1-2-3 to write notes, of course, but that was a “very unkind” way to do it.
Continuing his demo, Wilson showed how you could import the spreadsheet into the word processor. When doing so, you could still work with the spreadsheet inside of the word processor. So for example, you could change values within the spreadsheet and have the program perform the necessary recalculations. These changes were also reflected in the original spreadsheet. You could edit the spreadsheet within the word processor, and vice versa. The program could also split the screen horizontally into two windows, running the spreadsheet on the top half and the word processor on the bottom half.
Cheifet asked if the word processor component of Words and Figures was a “full-powered” program. Wilson said no, the word processor was designed specifically to be compatible with a spreadsheet. It was effectively a layer on top of the spreadsheet.
Returning to Roth, Cheifet asked for further clarification on “using uncertainty” in a spreadsheet with Predict!. Roth said when people talked about uncertain things, they made statements like, “My sales would be between two various numbers.” They weren’t dealing with absolute numbers like what you typically needed with a spreadsheet. And if you didn’t have the capability of representing uncertainty, then when you did present the results in a forecast, you were leaving out the majority of your data. Predict enabled you to encapsulate all of the possibilities for a particular variable on your spreadsheet–with all of the possibilities associated with that–and do calculations based on those probabilities.
Cheifet asked for a demonstration. Roth said the best way to show what he meant was to give a comparison between the way people use spreadsheets and the way they could use Predict! in a similar situation. He pulled up a simple spreadsheet that looked at sales, costs, and profits. So if you entered $1,000 in sales and $500 in costs, the spreadsheet calculated you had $500 in profits. If you wanted to do a “what if?” with different possible sales figures, you would have to go back and enter each change manually in different cells.
But with Predict!, Roth continued, you could represent all the values for a particular variable–in this case, sales–in a single cell. You did that by creating a distribution. There were eight pre-defined distributions in Predict!, and a ninth that the user could define. For this demonstration, Roth asked for a triangular distribution, which looked at a possible range of sales between $500 and $1,000, with the most likely figure being $700. He instructed Predict! to maintain a list of 100 “what ifs?” within this range. (The software could track up to 8,000.) He then did the same thing for costs, entering a uniform distribution of between $300 and $700 without a middle point.
Roth then had Predict! run those 100 “what if?” scenarios automatically. You could then view the results as a graph, which plotted the 100 “profit” projections along a probability curve. Cheifet asked if you could calculate the odds of a loss. Roth said you could. In this sample, those odds were 8 percent.
Cheifet asked about the consequences of the new IBM PS/2 platform on software development. Roth said people using a program like Predict! needed a machine that could perform a lot more computations and store more data. So a machine like the PS/2 would be a boon to their product.
Kildall asked if graphical interfaces would become standard in these sorts of applications. Roth said he didn’t know. People were used to the traditional spreadsheet format. Whether they wanted something else to get the job done, only time would tell.
Supercomputer Makers Continued to One-Up Each Other
Susan Chase presented this week’s “Random Access,” which was recorded in April 1987.
- Lotus Development Corporation signed a 10-year agreement with IBM to design software for its largest computers, starting with a version of 1-2-3 for the System/370 mainframes scheduled for release in 1988. The deal put Lotus on a more even footing with Microsoft, which recently overtook Lotus as the world’s largest manufacturer of PC software. Chase noted this meant that Ashton-Tate was now the only one of the “Big Three” software makers without an IBM relationship.
- Lotus also announced two other versions of 1-2-3 with “multidimensional” support capability, a line of multi-user database programs, and an enhanced programming capability for 1-2-3.
- ETA Systems unveiled the ETA-10, a supercomputer capable of processing 10 billion calculations per second. ETA, a subsidiary of Control Data Corporation, claimed this new machine had twice the performance of Cray Research’s supercomputers. Chase said that Cray, however, claimed its Cray-2 was three times faster than the ETA-10.
- Thinking Machines Corporation announced its own supercomputer that it claimed was faster than both the ETA-10 and Cray-2 when performing certain tasks.
- Apple announced plans to create an independent software company to distribute programs made by small developers. Chase said the new company would sell programs written by other companies that did not otherwise have the resources to market and distribute their products. The new company would also sell Apple-developed programs under its own label.
- Paul Schindler reviewed “MORE” (Living Videotext, $295), a graphical outlining and database program for the Macintosh.
“Trapeze” Was Ahead of Its Time
Trapeze was perhaps the most forward-looking program demonstrated in this episode. Andrew Wulf later wrote on his personal blog that Trapeze was in many ways a spiritual ancestor to Numbers, the spreadsheet that Apple first released for the Mac in 2007:
Like Numbers, Trapeze featured smart tables (which we called blocks), charts (2D and 3D), graphics and text, all freely movable around a canvas (which we called a sheet). Blocks were related by name (either the whole block, or tables where each column had a subname). Smart resizing occurred when you change related block sizes (i.e. add rows to a block and all dependent blocks resized and shifted location if necessary).
Wulf started programming in 1981 when he joined the defense contractor General Dynamics in Texas. Wulf, a chemist by training, spent the next three years learning to program on a variety of systems, including the Apple Lisa. When the Macintosh launched in 1984, he quit his job and decided to develop software for the new platform.
At first, Wulf didn’t have an actual product in mind. He started out developing templates for existing spreadsheets like Multiplan, Microsoft’s predecessor to Excel. But he quickly became frustrated with the limits of the software and started thinking about making his own spreadsheet.
At the time, Wulf was sharing an office suite with a person he described as an “older guy” who ran a consulting company. This person–whom I believe was Bill Towler–convinced Wulf to turn his idea into a product. The pair incorporated Data Tailor, Inc., in Fort Worth, Texas, with Towler as chairman and CEO and Wulf as president. Wulf then hired two other programmers, Bob Murphy and Ken Clark, to help him develop Trapeze.
The development took up most of 1986. That November, MacWorld ran what appears to be the first press mention of the product. But the formal launch took place at the January 1987 MacWorld Expo in San Francisco.
In March 1987, Towler told the Fort Worth Star-Telegram that Data Tailor’s first-year sales target for Trapeze was 21,000 units at a retail price of $295. To put that in context, Apple projected Macintosh sales of between 500,000 and 600,000 units in 1987. The Telegram calculated that meant Data Tailor only needed to capture about 1-in-12 of those buyers to meet its projections.
Indeed, Towler’s stated goal was to be the number-two spreadsheet on the Macintosh after Excel. But when all was said and done, Wulf said that only about 13,000 copies of Trapeze sold during its life cycle–or roughly 60 percent of Towler’s first-year projection. Wulf largely credited the underwhelming consumer response to what he described as a negative review from MacUser written by a “guy who had a bad day” and took it out on his product.
The review in question was by Robert R. Wiggins and appeared in the June 1987 issue of MacUser. I wouldn’t characterize the review as a “hatchet job,” but Wiggins was clearly frustrated by Trapeze’s non-traditional approach to creating spreadsheets and what he perceived as its shortcomings compared to Excel:
To begin with, [Trapeze is] not easy to learn and use right away. It takes some time to become accustomed to all the different cursors and pop-up menus and/or learn the key equivalents. This is one Macintosh program where reading the manual is definitely in order. And while the manual has an excellent tutorial and good descriptions of the built-in functions, it is not always that useful as a reference.
If you are a heavy spreadsheet user, Trapeze takes a lot of getting used to, and just plain doesn’t do some things that other spreadsheets do. There is no macro capability, for example, so although the built-in function list is impressive, you cannot add your own. Linking worksheets requires that they all be open (opening a single worksheet of a lined set with generate a lot of NAs–it doesn’t store the most recent value the way Excel does). Formulas work on blocks, so if you have worksheets with formulas going across and down at the same time, you either have to use single cell blocks or use complicated extraction functions (
XBLOCK(1,2,1,1,Revenue) is not exactly intuitive). The charting capability of Trapeze doesn’t offer the kind of flexibility that Excel does, although for simple charts you might find it adequate.
MacWorld offered a much more favorable review in its May 1987 issue, with Prasad Kaipa and Edwin Haskell writing that Trapeze actually “fills some of the gaps left by power spreadsheets such as Microsoft Excel,” while agreeing with Wiggins that the software “may be more difficult to learn than other spreadsheets.” That said, Kaipa and Haskell recommended the program, noting that “once you set up and organize your data, it is much easier to work with Trapeze than Excel, and it is useful to have all the information about a project in a single file.”
Wulf himself conceded that the biggest barrier for many customers was the inability to import spreadsheets from either Lotus 1-2-3 or Excel. And while Trapeze did develop a small, loyal following, it wasn’t enough to keep Data Tailor afloat as an independent software publisher. In July 1987, the company shipped a revised version of Trapeze that attempted to address some of the criticism. Towler also tried to re-brand the program as an “integrated presentation worksheet” rather than a spreadsheet. He also hiked the price $100 to $395.
But just a few months later, in January 1988, Data Tailor sold the rights to Trapeze to Boston-based Access Technology, Inc., for around $2 million. Access was best known at the time for developing 20/20, a spreadsheet for UNIX-based systems. Data Tailor effectively went out of business at this point. Wulf and his programming team had already left the company and created their own software consulting firm, SU5, Inc., which continued to update Trapeze for Access Technology.
Later that year, in August 1988, H&R Block acquired Access Technology in a $36.75 million stock swap. Around the same time, H&R Block also purchased MindWork Software, which published the MindWrite word processor for the Macintosh. MindWrite and Trapeze were then consolidated within a new Access Technology unit under CompuServe, which was also an H&R Block subsidiary.
Trapeze didn’t fare much better under this new arrangement. By April 1989, Access Technology discontinued retail sales of both Trapeze and MindWrite and only offered them by mail order. So Trapeze, which initially sold for $295 at its 1987 launch, was available for just $59.95 just two years later.
Ray Kingman, Access Technology’s marketing director, soon bought out the company’s Macintosh software division, which he reorganized as DeltaPoint. While Trapeze finally died under DeltaPoint’s watch, Kingman contracted with Wulf’s SU5 to create a new graphics presentation program, DeltaGraph, which proved far more successful. So much so that later versions of DeltaGraph remained on the market until at least 2015. (Wulf’s company stopped developing DeltaGraph in the mid-1990s.) Wulf himself retired a few years ago from programming to focus on his work as a digital artist.
Notes from the Random Access File
- This episode is available at the Internet Archive and was first broadcast around April 7, 1987.
- Like Adam Osborne’s Paperback Software, Richrd Bezjian’s Mosaic Software also contested the Lotus Development “look and feel” lawsuit. The two cases were initially supposed to be tried together, but Mosaic’s attorney dropped out on the second day of the 1990 trial due to illness. Mosaic then agreed to abide by the judge’s decision in the Paperback case. As I explained in my last post, the judge ruled in favor of Lotus, and both Paperback and Mosaic were forced to withdraw their products from the market as part of an overall settlement. In 1995, however, a federal appeals court rejected the “look and feel” argument in a separate lawsuit that Lotus brought against Borland International. Unfortunately, Mosaic Software was already defunct, having closed its doors sometime around 1994.
- Following the demise of Mosaic Software, Richard Bezjian started a new company, Boomerang Software, where he served as CEO from 1997 to 2008. Since 2008 he has been president and CEO of Energize Global Services, a financial technology company.
- Tim Hale is still a practicing attorney in California.
- Mike Slade joined Microsoft in 1983 and stayed until 1990, when he moved over to Steve Jobs’ NeXT Computer. Slade then served as CEO of Starwave, an early internet company created by Microsoft co-founder Paul Allen, from 1993 to 1998, when the business was sold to Walt Disney. Slade later reunited with Jobs at Apple, serving as a strategic advisor until 2004. And of course, Slade has been active in venture capital since the early 2000s.
- Camilo Wilson purchased one of the first IBM PCs released at retail in California in June 1981. Dissatisfied with the early word processors available for the system, he developed his own, which became known as Volkswriter. Wilson borrowed $15,000 to start Lifetree Software, which marketed Volkswriter. By 1984, the company had sold 40,000 copies of Volkswriter and employed 27 people. Other programs like Words and Figures and Correct Grammar followed. Wilson eventually sold Lifetree to WordStar International in February 1991 and joined the company as vice president of its new Writing Tools Group. WordStar itself ceased to exist after a 1994 merger into SoftKey International. Wilson went on to start an internet services company, Cogix, which is still active today.
- I couldn’t find much information on Richard Roth and Predict! A London-based venture capital firm, Oil Partnerships, initially contracted Roth to write Predict! around 1984. According to PC Week, Oil Partnerships wanted software to replace Lotus 1-2-3 that could perform Monte Carlo Simulations, which is essentially what Roth was describing in his Chronicles demo. Roth later worked for Unison Technology, a U.S. subsidiary of another British company, which released Predict! as a commercial product in January 1987. I don’t know what became of Roth or the product after that.
- Apple’s new software company was called Claris Corporation. Claris later became best known for its FileMaker database product, which it purchased from the original developer in July 1988. FileMaker became so successful that Claris eventually discontinued its other products and spun-off from Apple in 1988 as FileMaker, Inc. FileMaker revived the Claris name in 2019 and continues in business today as Claris International Inc.
- That 10-year deal between IBM and Lotus would technically never be completed, as IBM acquired Lotus outright in 1995.
- Apple released the Macintosh II on May 1, 1987. This episode of Chronicles was taped a few weeks beforehand. Andrew Wulf later wrote that he obtained a pre-production version of the Mac II’s 13-inch color monitor for use on the broadcast. That means this episode was quite possibly the first on-air demonstration of a color Mac.